When maps tell a story.
Drop in reports, spreadsheets, photos or news. Agents built on Muse find every event with a place and a time, hunt for patterns, and hand you an animated map you can question in plain language.
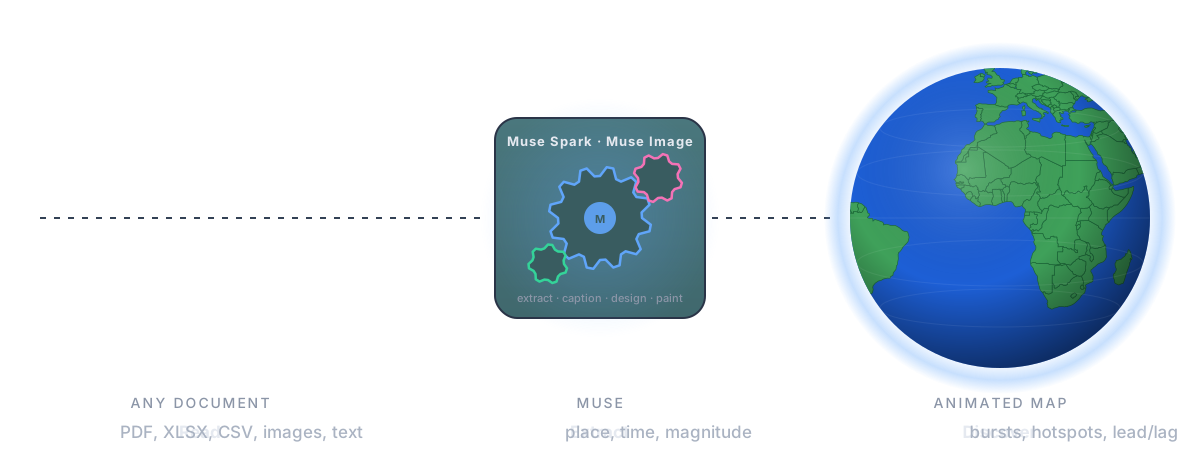
Any file. Tables are column-mapped once by the model, then converted row by row. Prose and images go through Muse Spark's vision and structured extraction.
Each event gets coordinates, a timestamp and a confidence score. Places are geocoded; magnitudes and entities are captured.
A pattern engine scores temporal bursts, spatial hotspots, outliers, silences and lead/lag relationships between categories.
In Studio you choose the map look and markers, then save. The view link shows exactly that; only you and your editors can change it.
Demos
Four stories, one engine.
Each is a saved story. Open the view, scrub the timeline, ask it questions. Make your own in Studio.
Eighty phone photos, a parent's day-by-day journal and the expense sheet from four weeks across ten cities. Positions and times come from the pictures, Muse Spark writes the captions and reads the journal, and the map replays the trip.
All 149 shows of the highest-grossing tour ever, with attendance per night and the incidents, records and releases around them. Watch it circle the world twice.
Two centuries of masterpieces plotted where they were made. See the center of gravity move from Florence to Rome to Venice and beyond.
A fictional drink brand's 300+ event sponsorships worldwide from 2015 to 2025, with a strategy memo. Find the pivots, the outliers and the cause and effect.